
LibraryThe funnel said 100 percent. Two people were paged.
The funnel said 100 percent. Two people were paged.
Report the rate that reached a person, per million, beside the counts it came from. A rounded reduction percentage is accurate until it becomes persuasive, and in operations it becomes persuasive at exactly the scale where it stops being true.
A sentence that passed every check but one
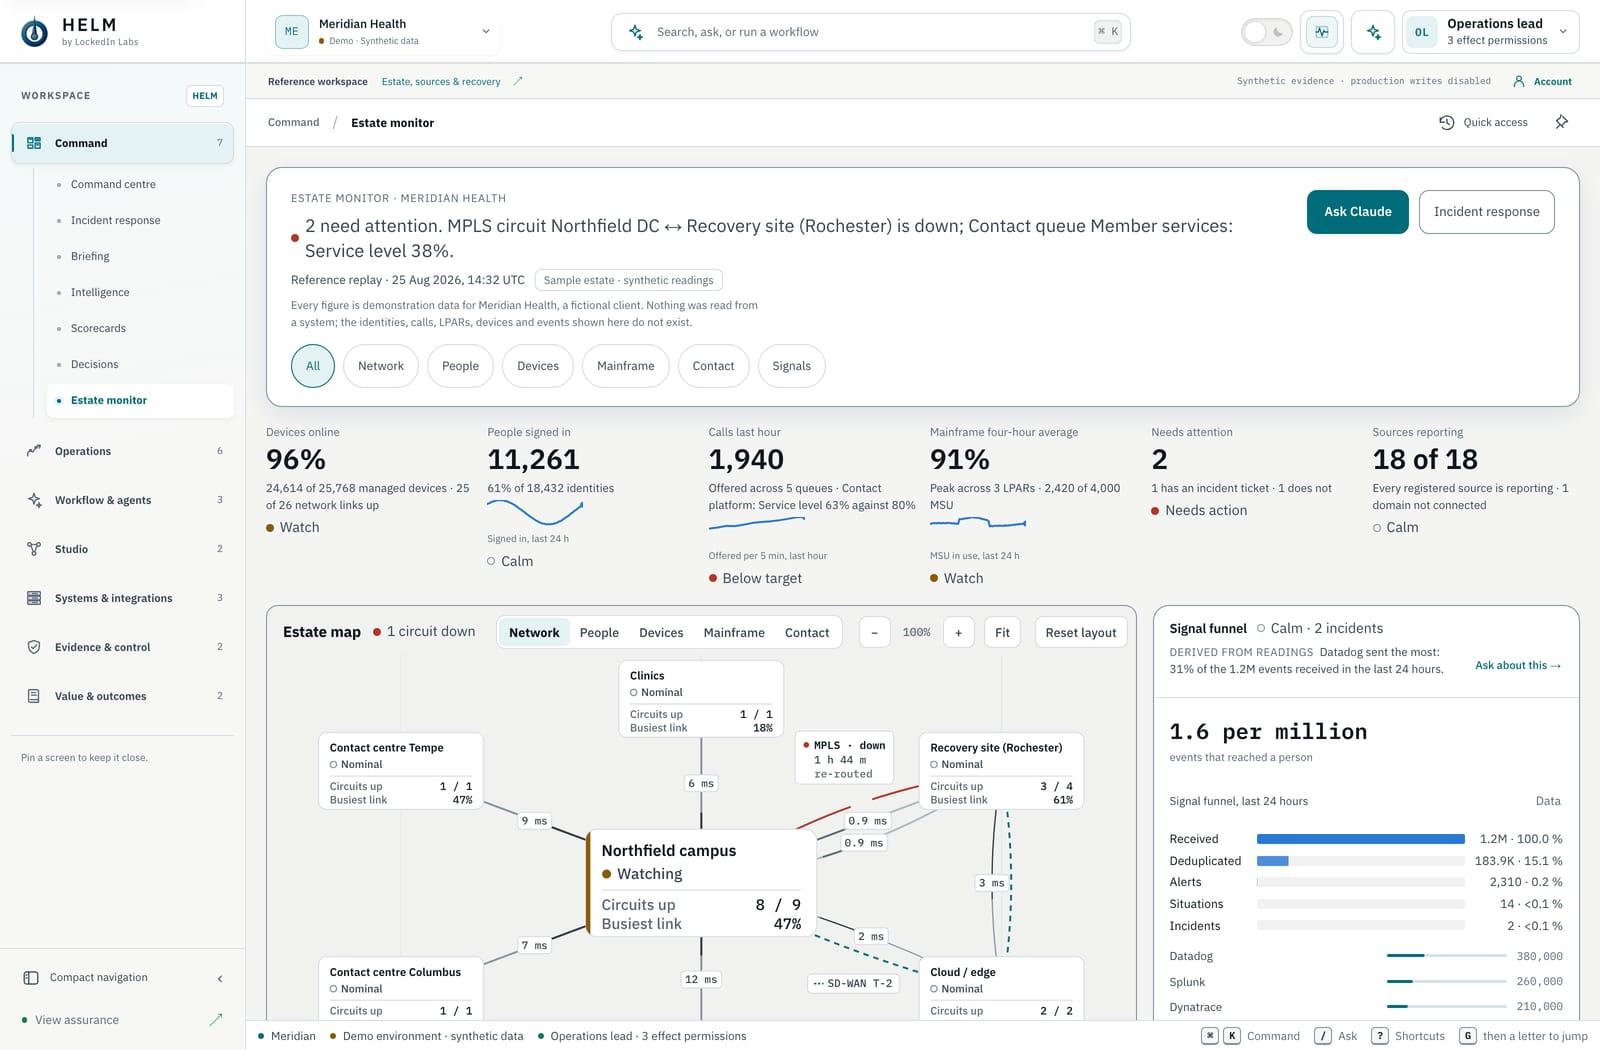
The signal funnel on our estate monitor reads its sample estate the way a real one would: 1,214,600 events received in a day, 183,900 left after deduplication, 2,310 alerts, 14 situations, 2 incidents. Under the funnel sat a sentence the pane wrote for itself: "1.2M events became 2 incidents, 100.0% never reached a person."
Every number in that sentence came from the engine. The arithmetic was right. Two divided by 1,214,600, subtracted from one and rounded to one decimal place, is 100.0. A reviewer caught it before it shipped anyway, because the sentence made a claim the numbers beside it contradicted. Two incidents did reach a person. Somebody was paged twice. The sentence said nobody was.
We changed it to "1.6 per million reached a person." Same data, same rounding rule, different unit. The rest of this piece is about why that unit change is not cosmetic, and why we think every operations platform that reports noise reduction should make it.
Why the percentage is the wrong unit
A reduction percentage answers the question "how much did we remove?" That is the vendor's question. The operator's question is the inverse: "what got through, and was it the right thing?" At small volumes the two questions read the same. At the volumes a modern estate produces they diverge completely, because the percentage saturates.
Past a few hundred thousand events a day, any competent correlation layer rounds to 99.9 percent and then to 100.0. From that point the number stops moving. A platform that suppresses everything, including the outage, reports 100.0 percent. A platform that lets through two real incidents also reports 100.0 percent. A platform that lets through forty false ones reports 99.997, which most dashboards round to the same 100.0. The figure has lost the ability to distinguish good from bad at the exact scale where the distinction matters.
Reliability engineering solved this a long time ago by counting the defects instead of the yield. Nobody describes a payment system as "99.9999 percent successful" when they can say "one failure per million transactions." The second form keeps the residue visible, and the residue is what someone has to act on.
The remainder is not noise left over from the product. The remainder is the product.
The remainder is the product
It is tempting to treat the events that get through as leftovers, the part the funnel failed to remove. That framing is backwards. The funnel exists to protect a scarce thing, human attention, and the events that reach a person are the entire output of that protection. The remainder is not noise left over from the product. The remainder is the product.
Once you accept that, the questions you ask of a funnel change. You stop asking how high the reduction is and start asking about the two incidents. Were they the right two? Did a third real one get folded into a situation and lost? How long did each wait between the first event and a named owner? None of those questions can be asked of "100.0%," and all of them can be asked of "2 of 1,214,600, here they are."
That is why our funnel shows every stage as a count with its share of the first stage beside it, and lists the sources by volume with their own counts. The per-million figure is the headline because it is the only summary that still moves when the thing an operator cares about moves.
Where each stage earns its number
A funnel is only as honest as its stage boundaries, so each one in ours is a definition rather than a label. Received is every event a connected source delivered in the window, counted before anything is dropped. Deduplicated is what remains once identical events from the same source within the same short interval are folded together; on the sample day that removes about 85 percent of the volume, which is normal and says more about chatty sources than about intelligence. Alerts are deduplicated events that crossed a rule. Situations are alerts correlated into one named problem. Incidents are situations a person was asked to own.
Written out like that, the interesting stages are obvious. Deduplication is plumbing. The step from 2,310 alerts to 14 situations is where correlation either earns its keep or quietly merges two real problems into one, and the step from 14 situations to 2 incidents is a human judgment the product should record, not hide inside a percentage.
The same error, pointed the other way
Rounding does not only flatter. It also invents movement. In the same sample estate, service-level attainment for one client went from 99.65 percent to 99.60 percent between two weeks. On a dashboard that is a red down arrow. In reality it is five hundredths of a point on a measure that wanders by that much on an ordinary Tuesday.
When we built the executive "what changed since last Monday" view, we gave every governed metric a materiality line in its own unit before anything gets reported: a tenth of a point for service-level attainment, two incidents or thirty percent for incident counts, a quarter for restore time, fifty thousand dollars for open risk. The 0.05 point move does not cross its line, so it is not reported. The restore time that went from 194 minutes to 918 minutes the same week does, and it leads the list.
A figure that is too smooth hides real change. A figure that is too sensitive manufactures it. Both failures come from the same habit of reporting a ratio without asking what size of change the reader should care about.
The obvious objection
The fair objection is that executives read percentages and do not read per-million rates. A board slide that says "we removed 99.99 percent of the noise" lands. A slide that says "1.6 per million reached a person" needs a sentence of explanation.
We think the sentence of explanation is the point. The percentage lands because it sounds like completion, and completion is precisely the claim an operations team should never make about its alerting. The per-million rate invites the next question, which is always some version of "who were the 1.6, and were they right?" A number that provokes the right question in a board meeting is doing its job. A number that ends the conversation is a liability the first time the outage it absorbed turns up in a post-incident review.
There is also a practical answer. Nothing stops a slide from carrying both. What should not happen is the percentage standing alone, rounded, in a sentence that a reader takes as a statement about people rather than about events.
What to ask of any funnel
If you are evaluating a platform that reports noise reduction, three requests will tell you most of what you need. Ask to see the funnel as counts, stage by stage, for one real day. Ask what reached a person, by name of incident, and how long each took to reach an owner. Ask what the platform reports when a source stops sending, because a silent source makes every reduction figure look better, and a platform that cannot tell a quiet day from a dead connector will report its best numbers on its worst days.
The rounding error we caught was small, one sentence in one pane, fixed before anyone outside the team saw it. The habit behind it is not small. It is the habit of letting a ratio speak for the people it summarizes. In operations, those people are the ones holding the pager.